Candlestick patterns help traders read market sentiment through price action. Instead of treating candles as magical prediction tools, skilled traders use them to understand the ongoing battle between buyers and sellers.
The idea started centuries ago with Japanese rice traders who wanted a better way to track emotion in the market. Today, traders still use candlestick chart analysis because each candle reveals four important data points: open, high, low, and close.
When traders learn how to identify trends with candlestick patterns correctly, they stop reacting emotionally and start reading the market with more structure.
Why Candlestick Patterns Matter in Trend Analysis
Most beginner traders focus only on the candle shape. Professional traders focus on context.
A hammer pattern inside random market noise means very little. A hammer pattern forming directly on a major support level after an extended sell off tells a completely different story.
Candlestick patterns work best when they reveal a shift in momentum at important locations on the chart. This is why experienced traders combine patterns with support and resistance, trendlines, moving averages, and momentum indicators.
The candle itself does not predict the future. It visualizes current market imbalance.
That difference matters.
Understanding Market Psychology Through Candles
Every candlestick reflects a short story between buyers and sellers.
A strong bullish candle shows aggressive buying pressure. A long bearish candle shows strong selling control. Long upper wicks often reveal rejection from higher prices, while long lower wicks show rejection from lower prices.
This emotional layer gives candlestick patterns their power.
For example, when a bullish engulfing candle completely covers the previous bearish candle, it often signals a sudden shift in sentiment. Sellers controlled the market at first, but buyers stepped in with enough force to reverse momentum.
The pattern itself matters less than the psychology behind it.
Bullish Reversal Candlestick Patterns
Bullish reversal patterns often appear after a downtrend and suggest that selling pressure is fading.
The hammer pattern forms with a small body and a long lower shadow. The wick should usually measure at least twice the size of the body.
This structure shows that sellers pushed price lower during the session, but buyers regained control before the close.
The best hammer setups appear near strong support zones or after panic selling. Traders should avoid taking hammer signals in sideways conditions because random volatility creates many false signals.
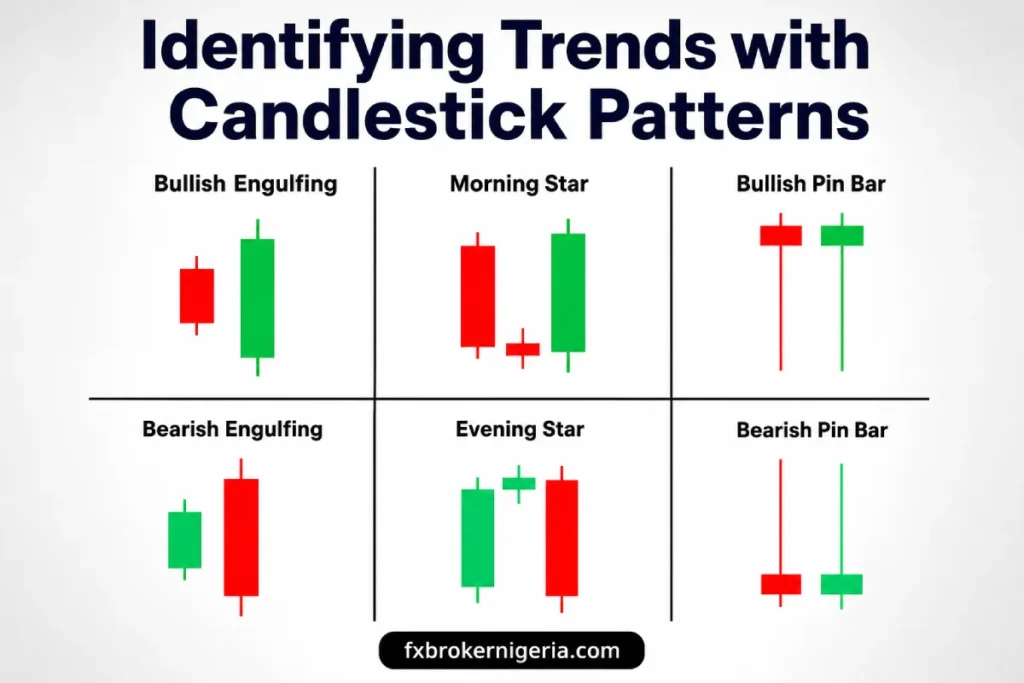
Bullish Engulfing Pattern
The bullish engulfing pattern forms when a large bullish candle completely covers the previous bearish candle.
This pattern represents a strong sentiment shift. Sellers started with control, but buyers overwhelmed them completely.
Many traders consider engulfing formations among the strongest high probability reversal patterns because they show aggressive momentum reversal instead of simple indecision.
Still, location matters more than the candle itself.
A bullish engulfing pattern near a key support level carries far more value than the same pattern appearing in the middle of a range.
Morning Star Pattern
The morning star uses three candles to show exhaustion and reversal.
The first candle continues the bearish trend. The second candle shows hesitation and reduced momentum. The third candle confirms bullish strength and closes strongly upward.
This pattern often appears after emotional sell offs where bearish momentum starts fading gradually before buyers regain confidence.
Bearish Reversal Candlestick Patterns
Bearish reversal patterns signal weakening buying pressure after an uptrend.
Shooting Star Pattern
The shooting star contains a small body with a long upper wick. The upper shadow should measure at least twice the size of the body.
This candle shows that buyers pushed price higher aggressively but failed to maintain control.
Sellers entered the market and forced price back down before the session closed.
Strong shooting star setups usually appear near resistance levels or after extended bullish momentum.
Bearish Engulfing Pattern
A bearish engulfing pattern forms when a large bearish candle fully covers the previous bullish candle.
This pattern signals a sudden change in market sentiment. Buyers lose momentum while sellers regain control aggressively.
Professional traders often wait for additional confirmation before entering because false reversals happen frequently in strong uptrends.
Evening Star Pattern
The evening star pattern reflects fading bullish momentum across three candles.
The first candle continues bullish movement. The second candle shows hesitation. The third candle closes strongly bearish and confirms the reversal.
This structure often appears near important resistance levels where institutional selling pressure enters the market.
Continuation Candlestick Patterns
Not every candlestick pattern signals reversal. Some patterns simply show temporary pauses before the existing trend continues.
Doji Pattern
A doji forms when opening and closing prices stay very close together.
This pattern reflects market indecision. Neither buyers nor sellers gain clear control.
Many traders misunderstand the doji. The pattern alone does not predict reversal. Instead, it warns that momentum may slow temporarily while the market searches for direction.
Spinning Top Pattern
The spinning top resembles the doji but includes a slightly larger body.
It signals uncertainty and balanced pressure between buyers and sellers.
In strong trends, spinning tops often appear before continuation moves. In weak markets, they may signal exhaustion.
Again, chart location matters.
Rising Three Methods
The rising three methods pattern appears during bullish trends.
A strong bullish candle forms first. Several small bearish candles follow inside the range of the first candle. Then another strong bullish candle confirms continuation.
This pattern shows that sellers attempted a pullback but failed to reverse the larger trend.
The falling three methods pattern works the same way in bearish conditions.
The Triple Filter Strategy for Higher Probability Trades
Many traders fail because they trade candlestick patterns in isolation.
A stronger approach uses confirmation filters.
Step 1: Analyze the Location
The most important question is simple.
Where does the pattern appear?
Candlestick pattern confluence increases significantly when the setup forms near support, resistance, trendlines, supply zones, or demand zones.
A bullish engulfing pattern inside random price movement means very little. The same pattern directly on weekly support creates a stronger trading opportunity.
Step 2: Confirm Momentum
Momentum indicators help traders avoid weak setups.
For example, RSI divergence can reveal fading selling pressure during bullish reversal patterns. Moving average alignment can also strengthen continuation setups.
Confirmation filters reduce emotional trading and improve consistency.
Step 3: Wait for the Trigger
Professional traders rarely enter immediately after a pattern appears.
They wait for activation.
For bullish setups, activation often means price breaking above the high of the pattern. For bearish setups, activation usually requires price moving below the pattern low.
This extra confirmation helps filter weak signals and false breakouts.
Pattern Reliability Score
Different patterns perform differently under real market conditions.
The table below provides a practical reliability overview when traders combine the patterns with confirmation filters and key chart levels.
| Pattern | Reliability | Best Environment |
|---|---|---|
| Bullish Engulfing | High | Major support after strong sell off |
| Bearish Engulfing | High | Resistance after extended rally |
| Hammer | Medium High | Panic selling near support |
| Shooting Star | Medium High | Overextended bullish trend |
| Morning Star | High | Reversal zones with momentum divergence |
| Evening Star | High | Resistance with fading momentum |
| Doji | Medium | Consolidation and breakout areas |
| Rising Three Methods | Medium High | Strong established uptrend |
| Falling Three Methods | Medium High | Strong established downtrend |
| Head and Shoulders | Very High | Large scale trend reversals |
No pattern guarantees success.
Market structure, timing, volatility, and trader discipline always influence outcomes.
Avoiding False Breakouts and Bull Traps
False breakouts damage many beginner accounts.
Price often breaks above resistance briefly before reversing sharply lower. The same behavior happens below support.
This is why traders should avoid emotional entries based on excitement alone.
Protective stop placement matters heavily here. Traders often place stop losses outside the pattern range to reduce exposure to market noise.
For example, traders may place stops above the upper wick of a shooting star or below the lower wick of a hammer.
This approach creates logical invalidation points.
You should also study proper position sizing and portfolio protection rules before increasing exposure. Articles like Risk Management Rules for Consistent Growth can help traders build a more disciplined framework.
The Hidden Enemy: Trader Psychology
Many traders know candlestick patterns perfectly but still lose money consistently.
The problem usually comes from psychology.
Confirmation bias causes traders to see only the setups they want to see. Overconfidence bias appears after winning streaks and leads to oversized positions. Loss aversion causes traders to hold losing trades too long.
Candlestick chart analysis for beginners should always include emotional discipline because technical knowledge alone rarely creates long term consistency.
Successful traders think like investigators.
They gather evidence, wait for confirmation, manage risk carefully, and avoid emotional decisions.
Final Thoughts
Identifying trends with candlestick patterns requires more than memorizing candle shapes.
Strong traders use patterns as part of a larger decision making process that includes market structure, momentum confirmation, key levels, and disciplined risk management.
The goal is not to predict every market move perfectly.
The goal is to identify situations where probability and market context align in your favor.
When traders combine candlestick patterns with patience, confirmation filters, and emotional discipline, they build a more professional approach to reading market trends.
FAQ
Are candlestick patterns reliable for beginners?
Candlestick patterns can help beginners understand market sentiment, but traders should avoid using them alone. Patterns become more reliable when traders combine them with support and resistance, momentum indicators, and proper risk management.
Which candlestick pattern works best for trend reversals?
Bullish engulfing, bearish engulfing, morning star, and evening star patterns often perform well during reversals, especially near major support or resistance levels.
Why do candlestick patterns fail?
Patterns fail because markets remain unpredictable. Many traders ignore context, enter too early, or trade patterns without confirmation filters.
What timeframe works best for candlestick analysis?
Candlestick patterns appear on all timeframes because markets behave in fractal ways. Higher timeframes often provide stronger signals because they contain more market data.
Should traders use indicators with candlestick patterns?
Yes. Indicators like RSI, moving averages, and volume analysis can help confirm trend strength and reduce false signals.